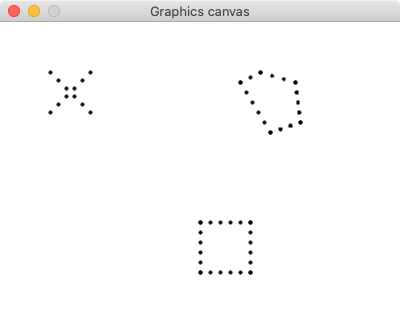
Drawing dotted lines using simplegraphics is not hard, it just requires working through the math. We will draw our dotted lines using filled circles of radius 2, spaced roughly ten pixels apart on the screen, to draw the dotted lines. The effect is that they will look like this:
Read through all of these instructions before you start writing code. The instructions will walk you through the math, the algorithm, and how to write the Python code.
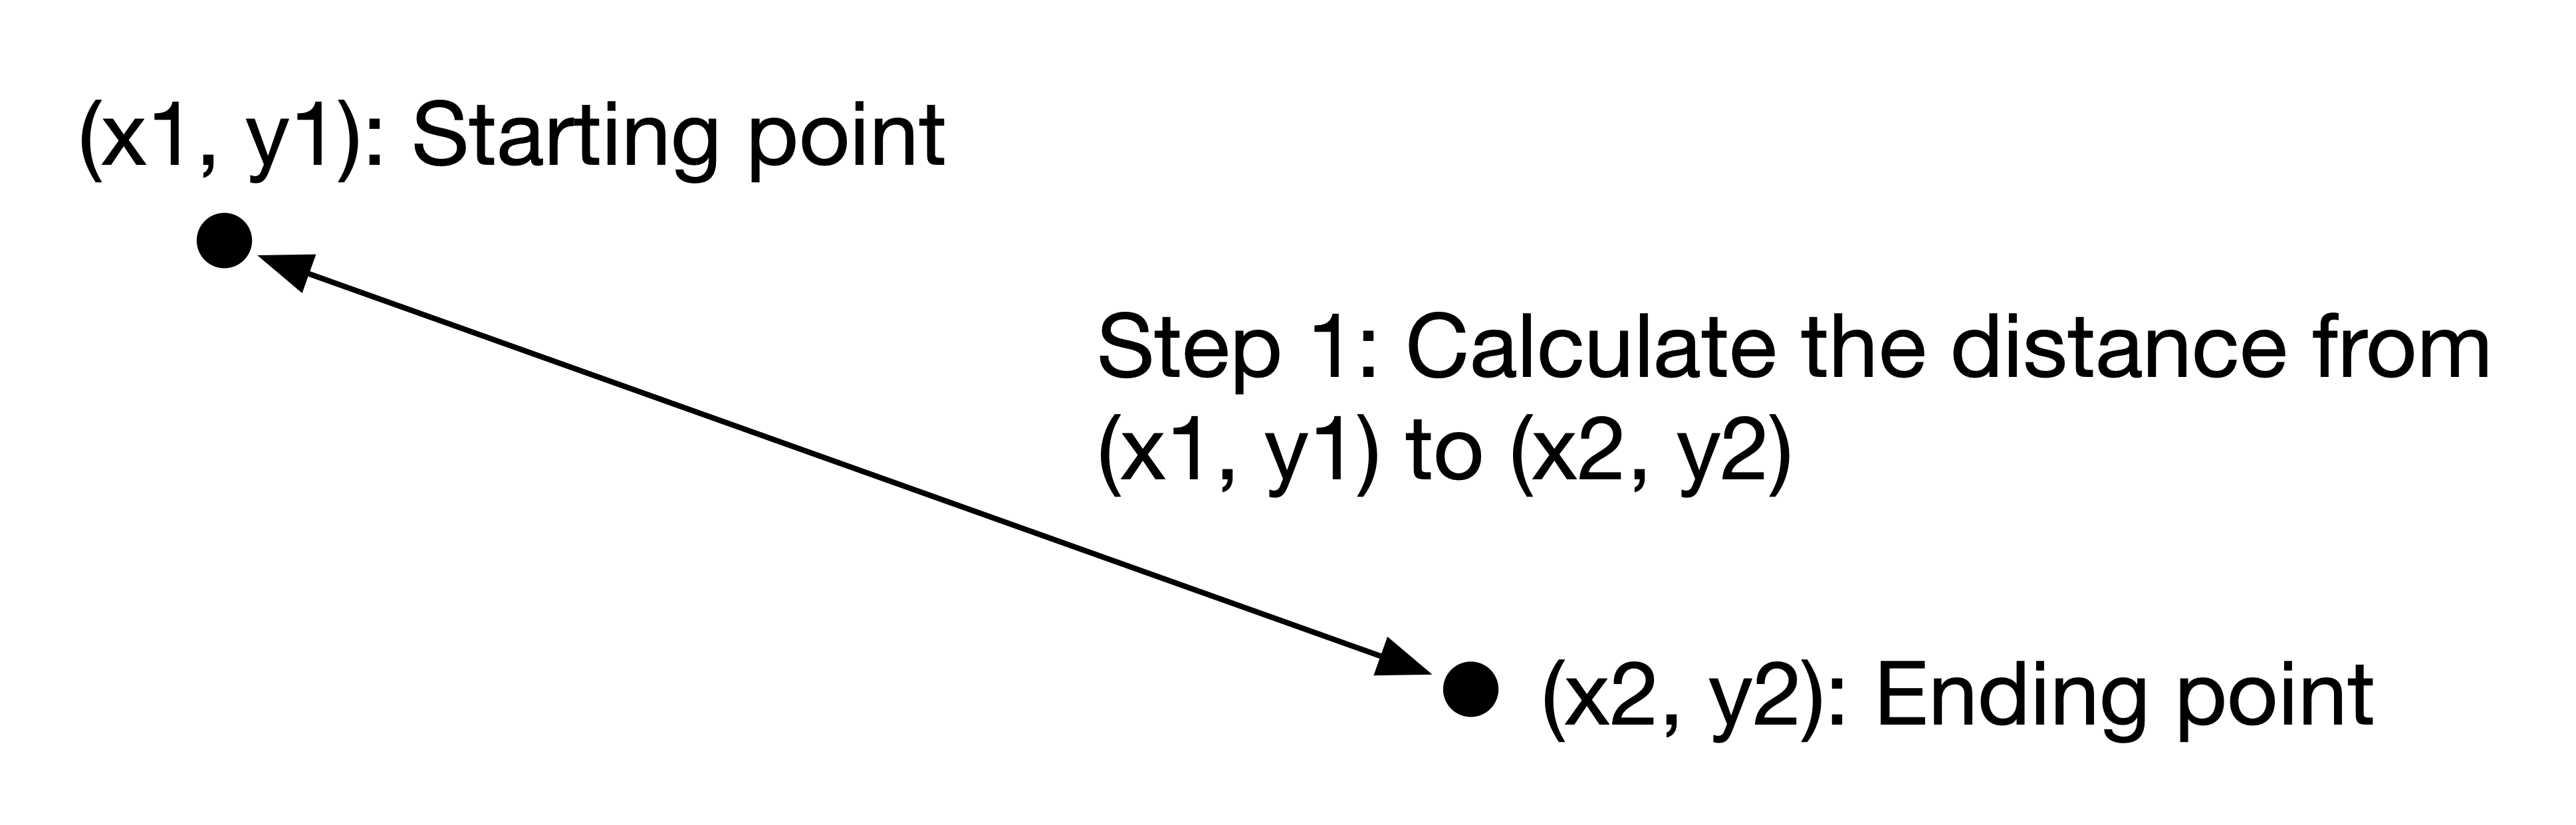
Let's figure out the math. Say you are drawing a dotted line from the point \((x_1, y_1)\) to \((x_2, y_2)\).
The first step is to figure out the distance between the two points:
The next step is to figure out how many dots should be drawn along the dotted line between \((x_1, y_1)\) and \((x_2, y_2)\). We will draw the dots approximately ten pixels apart, so to figure out how many we want, we divide the distance by 10. Sometimes this will be a fraction, so let's always round down to make life simple. For instance, if the distance is 50, dividing by 10 gives us 5. If the distance is 48.7, then dividing by 10 and rounding down gives us 4.
This quantity will be the the number of gaps between the dots we must draw, meaning the number of dots is one larger than this number. For instance, to draw a dotted line of distance 50, there will be 6 total dots. If the distance is 48.7, we will draw 5 total dots:

To figure out where the dots go, we must figure out the exact spacing between each dot. Since the dots are equally spaced, this is just a division problem. To help figuring out where to draw the dots, we will calculate the space between the dots not directly between them, but as separate x- and y-components (trust me, this will be easier).
First, calculate the total change in the x-direction, and the total change in the y-direction (just subtract the x-coordinates and y-coordinates from each other). Then divide each of these distances by the number of gaps (not the number of dots). This will tell you the distance between each dot in the x-direction (which we will call the x-step), and the distance between each dot in the y-direction (which we will call the y-step). Note that x-step and/or y-step may be negative, if the line is drawn either in a leftward direction (a negative x-step), or in an upward direction (a negative y-step), or both!

If we are given the starting point and the ending point of our dotted line, the algorithm involves using math to calculate the numbers described above, and then drawing the line itself. Here is the pseudocode:
int() function to do this). This is the number of gaps in the line.Now draw the line:
To implement this in Python, do the following:
Define a function called draw_dotted_line(x1, y1, x2, y2). This function will take four parameters, which will be the starting (x1, y1) and ending (x2, y2) points of the dotted line you wish to draw on the canvas.
Turn the pseudocode above into Python code. I suggest defining variables for each of the mathematical calculations.
Use a loop to draw the dots at the appropriate locations.
Write a test program using simplegraphics to test your code. Here's an example:
def main():
  open_canvas(500, 500)

  # test horizontal line drawing
  draw_dotted_line(100, 100, 300, 100)

  # test vertical line drawing
  draw_dotted_line(150, 150, 150, 350)

  # test horizontal line drawing leftwards
  draw_dotted_line(300, 120, 100, 120)

  # test vertical line drawing upwards
  draw_dotted_line(180, 350, 180, 150)

  # make up four tests here to test drawing in the
  # four diagonal directions: northeast, southeast, northwest, southwest

close_canvas_after_click()When you are satisfied that draw_dotted_line works, you can return to working on the main program. It is not possible to finish the main program without
this function working.